By Jessica Kursman and Nick Zettel
In celebration of our 40th anniversary, and in response to the growing income inequality in Chicago, the Nathalie P. Voorhees Center is working to answer the question “Who Can Live in Chicago?”. We will be releasing a series of forthcoming reports on income inequality to unpack this question. Below please find a prelude to our research:
Who Can Live in Chicago?
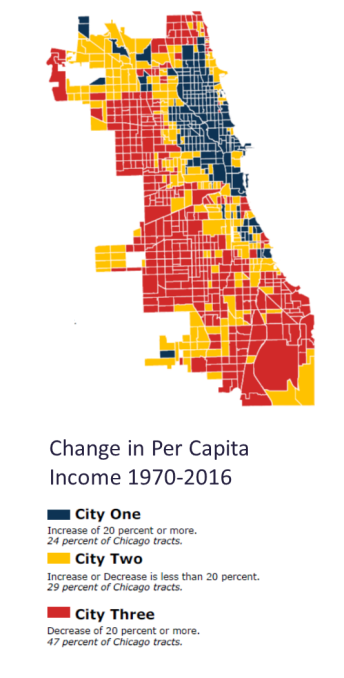
The Nathalie P. Voorhees Center analyzed change in income in the seven-county Chicago Metropolitan Region from 1970-2016, assessing each Census Tract’s average per capita income relative to the region at different points in time. As this map illustrates, Chicago is growing more segregated by income over time and losing its middle class.
The following animated GIF below displays a time lapse sequence of change in average individual income by decadal increments, between the years 1970-2016.
We followed the University of Toronto Three Cities methodology to map out the spatial distribution of wealth over time to identify three distinct cities:
- City One includes all Census Tracts that increased their proportion of regional income by 20 percent (622,099 people);
- City Three includes all Census Tracts that decreased their proportion of regional income by 20 percent (1,344,751 people); and
- City Two includes all Census Tracts that did not increase or decrease their proportion more or less than 20 percent (770,277 people).
Using the three cities, we then looked at race, income by race, age and families.
Race

Between the years 2010-2016*, City One gained over 43,000 white individuals and lost over 5,000 African American individuals. In stark contrast, City Three’s African American population decreased by nearly 60,000 individuals, and City Two’s African American population decreased by nearly 16,000 individuals.
Income by Race
These trends become even more important to watch when we look at income. In 2016, more than one-third of City Three’s African American population earned less than $20,000, and more than half earned less than $35,000. In City One, 45% of the white population earned more than $100,000. In fact, within Chicago overall, nearly 70% of households earning more than $100,000 were white, while more than half of households earning less than $20,000 were African American.
Age
Age is unevenly distributed across Chicago. City One has the largest share of residents between the ages 20 and 34. The majority of City Two residents are between ages 35 and 64 while City Three is predominantly composed of young people under 19.
Families
Between 2010 and 2016, City Two and City Three lost more than 47,000 families with children under 18, while City One gained more 5,500 families with children under 18. Still, City Two and City Three contain many more families (506,000+) with children under 18 in comparison to City One (90,000+). Additionally, both cities Two and Three contain many large families in Chicago. More than one-third of families in City Two are comprised of four or more people, while almost half of families in City Three are comprised of four or more people. In contrast, half of City One is families with only two people.
What do you think?
We would like to hear your thoughts on what these data suggest to you. Please take a few minutes to answer a few questions (anonymously of course).
Stay tuned…there will be more coming soon!
* 2010 and 2016 represent American Community Survey (ACS) five-year estimates. 2010 represents ACS five year estimates from 2006-2010. 2016 represents ACS five-year estimates from 2012-2016. The Voorhees Center used five-year estimates in accordance with the U.S. Census Bureau recommendation for precision and analyzing Census tracts.
** The US Census defines a family as a group of two people or more (one of whom is the householder) related by birth, marriage, or adoption and residing together; all such people (including related subfamily members) are considered as members of one family.

Why are you mixing per capita income with household income? A family of 4 with household income of $100k (a threshold you use) has lower per capita income than a single person with income of $35k (another threshold you use).
I don’t understand why this mixing of data is so common when discussing income distribution. But it is certainly more common than
LikeLike